
Tales from the Classroom: Reding’s Rabbits
Over the past week, I have had the privilege of working with Jim Reding and Tom Burkett and students across their 5 combined AP Environmental Science classes to meld technology into a traditional lab on genetics. This was the third time that we have taught this lesson and, as with each past iteration, we were able to make some improvements over last year’s lesson. Through this experience, we hope to offer students a few insights:
- Experience how technology and simulations impact the “real world” of scientific inquiry and study
- Gain some minor exposure to computer science, computational thinking, and a programming language (Python, in this case)
- Develop some understanding of how programmers must structure a problem so that it can be tackled by a computer, including potential limitations, seqeuncing of instructions, and common programming elements that help represent “real world” concepts digitally.
This project began in 2016 when Jim approached me about a lab that his students complete regarding natural selection. In the original lab, students use pinto and navy beans to represent dominant and recessive alleles for fur color in rabbits. The original lab tasks students with pulling random pairs of beans out of a bag to represent rabbits, apply some mortality rates across their population of rabbits, and calculate how the mortality rates of brown versus albino rabbits impacts the diversity of dominant and recessive alleles within the population. In total, the lab consists of a population of 50 rabbits studied over 5 generations. The exact instructions of the lab can be found here.
As Jim makes sure to point out to students when we do this lesson, a population of 50 rabbits is highly unrealistic when we are trying to model the “real world” behaviors of allele frequency. Additionally, five generations of study do not provide much forecasting of the rabbit population- perhaps 2 or 3 years, at most. With these limitations in mind, Jim approached me to ask if I believed this could be expanded upon with programming, possibly by his students. While I didn’t feel that we could develop his students’ programming proficiency quickly enough to build such a system on their own, I did see this as a very attainable solution that I could develop and then share with his students. The final product can be divided into two portions- Understanding the Program and Using the Program.
Day 1- Understanding the Program
The first portion of this lesson involves introducing students to a couple of fundamental programming concepts, understanding how they can be used within the context of this specific lab, and understanding how to recognize these concepts within some “code.”
In our first iteration of this tech-enhanced lab, we gave students a quick crash course on some programming fundamentals and then asked them to write some “pseudo code” for the program. With a lot of guidance, they were able to complete this task, but we felt that they left feeling a bit confused and frustrated, with little understanding of those programming concepts we had hoped to teach. As a result, we changed this portion of the lab to provide students with some code up front and then taught them how to “translate” that code back into plain English.
In our current configuration, students receive a version of the original lab written as “pseudo code,” which is somewhat equivalent to an outline for a traditional paper. Pseudo code outlines the general ideas of the program and how they should be modeled within the program, but does not use the exact code of our final program. You can see the pseudo code for our program here.
To help students understand this pseudo code, we run through this brief presentation that talks about some core Computer Science and programming concepts at work in the program. Specifically, we cover:
- Variables
- Arrays
- Loops
- Conditionals
The presentation provides some explanation of the purpose of each concept within programming and demonstrates the symbols or keywords that show up in our pseudo code to help students locate these ideas “in action.” The “tools” for identifying these concepts in action within the pseudo code are also shared via this Google Doc “Pseudo Code Cheat Sheet.”
At the end of this portion of the lesson, students are tasked with comparing the pseudo code and their original lab instructions to determine which lines of code apply to each instruction within the original lab. We review the correct translation in class the following day.
Day 2- Using the Program
After our Day 1 programming overview, we jump into what is, for most students, the “meat” of the project. In Day 2, we hand over the program to the students and teach them the basics of how to use the simulation. The program is a fairly straightforward text-based program that allows students to customize a few “starting conditions” for the experiment:
- Population Size
- Interval of printed results (Print results for every nth generation)
- Brown Rabbit Mortality Rate
- Albino Rabbit Mortality Rate
With this configured, the program will run and output generational data for every nth generation including:
- Number of brown rabbits in that generation
- Number of albino rabbits in that generation
- Number of albino rabbits that die in that generation
- Number of brown rabbits that die in that generation
- Remaining rabbits in the population after mortality rate eliminates some of the population
- Remaining dominant alleles in the population after mortality rate
- Remaining recessive alleles in the population after mortality rate
- Percentage of remaining alleles that are dominant
- Percentage of remaining alleles that are recessive
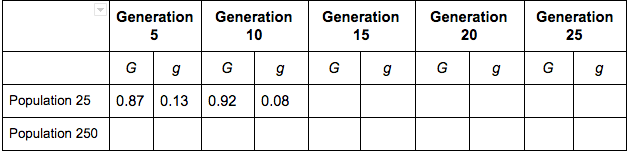
Equipped with this output from the program, students are tasked running the program five times (let’s call each run-through an experiment) with varying starting conditions. For each experiment, students are asked to record the allele frequency of dominant alleles (Dominant percentage remaining, divided by 100) and the frequency of recessive alleles (Recessive percentage remaining, divided by 100) left in the population at generations 5, 10, 15, 20, and 25.
The starting conditions fall into two categories- 1) Changing population, constant mortality rates and 2) Changing albino mortality rate, constant population. These allow students to study the impact of population size of the rate of change for allele frequency within a population, as well as the impact of mortality rate on that rate of change. At the end of the lab, students graph their results and answer some questions to help develop this understanding.
In total, this simulation of the original lab offers incredible new opportunities to students by drastically reducing the time required to complete experiments. The original bean-counting-by-hand experiment takes about 50 minutes to study a population of 50 rabbits over 5 generations. The simulation handles that same experiment in less than 20 seconds, even when running exceptionally slowly. With this speed increase, students are easily enabled to study much more within a single 50-minute class period:
- Running multiple experiments with the same starting conditions to find the “average” results and develop a “model”
- Running multiple experiments with varying starting conditions (as we are doing above) to explore how various starting conditions can impact biodiversity within a population
- Experimenting with larger, more realistic populations- easily up to 5000 individuals without a drastic speed decrease
Summary
In total, this lab has been an incredibly enjoyable experience every year that we have taught it. The lesson provides students with an opportunity to see an example of the impact that programming has within other curricular areas, and the simulation itself unlocks the potential for students to explore a topic at much greater depth to develop a much more robust understanding. Although Day 1 of the lesson is usually rife with puzzled looks, Day 2 brings students some clarity and I have regularly received very positive feedback from students about how much they enjoyed the lesson and the chance to “peek behind the curtain” at some programming in action within their classroom!